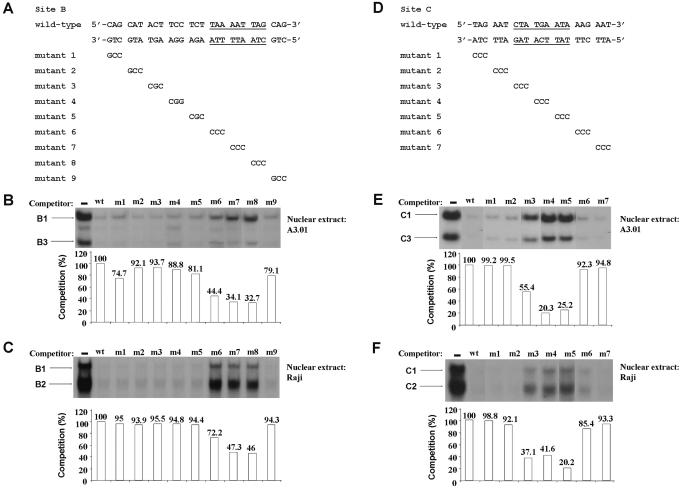
Figure 2.
Identification of the DNA sequences required for factor binding to the HS7 sites B and C. (A) Nucleotide sequences of the wild-type and mutant site B oligonucleotides are shown with underlined bases indicating the base pairs required for the formation of complexes B1, B2 and B3. For the mutant site B oligonucleotides, only the bases that are changed compared with the wild-type sequence are indicated. The wild-type site B oligonucleotide was 5′ end labeled and used as probe in EMSA competition experiments with nuclear extracts from A3.01 cells (B) or Raji cells (C) and wild-type and substitution mutant site B double-stranded oligonucleotides as competitors. Binding assays were performed in the absence of competitor or in the presence of a 100-fold molar excess of either the homologous site B oligonucleotide or one of the nine mutated sites B (m1–m9). The competitor used is indicated at the top of each lane. The figure shows only the specific retarded bands of interest. The complexes B1 and B3 (B) or B1 and B2 (C) are indicated by arrows. Quantification of EMSAs was performed with an InstantImager (Packard) and is shown for the B1 complex in both (B and C). The histograms indicate the competition activities of site B m1–m9 mutants expressed relative to the competition activity of the wild-type site B (100%). (D) Nucleotide sequences of the wild-type and mutant site C oligonucleotides are shown with underlined bases indicating the base pairs required for the formation of complexes C1, C2 and C3. The 3 bp region different from the wild-type site C sequence is indicated in the seven mutant site C oligonucleotides (m1–m7). The wild-type site C used as probe was incubated with nuclear extracts from A3.01 cells (E) or Raji cells (F) and wild-type and substitution mutant site C double-stranded oligonucleotides as competitors. Binding assays were performed in the absence of competitor or in the presence of a 100-fold molar excess of either the homologous site C oligonucleotide or one of the seven mutated sites C (m1–m7). The competitor used is indicated at the top of each lane. The figure shows only the specific retarded bands of interest. The complexes C1 and C3 (E) or C1 and C2 (F) are indicated by arrows. Quantification of EMSAs was performed with an InstantImager (Packard) and is shown for the C1 complex in both (E and F). The histograms indicate the competition activities of site C m1–m7 mutants expressed relative to the competition activity of the wild-type site C (100%).

