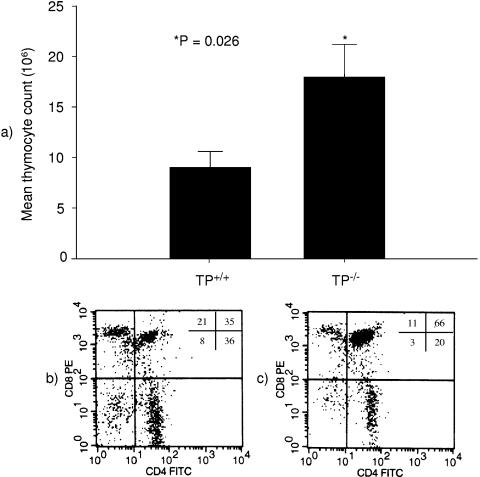
FIG. 5.
Thromboxane A2 contributes to LPS-induced thymocyte apoptosis in vivo. (a) The bar graph shows the total thymocyte count of TP+/+ and TP−/− mice (n = 9 of each genotype) 24 h after a single i.p. injection of 50 μg of LPS. One day after LPS injection, TP−/− animals had twice as many thymocytes as TP+/+ animals (18 ± 3 million versus 9 ± 2 million cells; P = 0.026). The flow cytometry plots below each bar are representative of those from nine experiments and illustrate the thymocyte phenotype of TP+/+ (b) and TP−/− (c) animals 1 day after LPS injection. The numbers inside the plot represent the contribution (%) of each thymocyte population to the total of gated cells: left lower quadrant, CD4− CD8− cells; left upper quadrant, CD4− CD8+ cells; right lower quadrant, CD4+ CD8− cells; right upper quadrant, CD4+ CD8+ cells. Compared to the TP+/+ animals, a significantly higher percentage of CD4+ CD8+ cells remained in the thymuses of TP−/− mice 24 h after LPS injection (62% ± 6% versus 41% ± 5%; P = 0.02). PBS-treated wild-type and knockout animals exhibited similar numbers of thymocytes (62.1 ± 19.3 million versus 55.8 ± 6.6 million cells, respectively; P = not significant) and percentage of CD4+CD8+ cells (88.2 ± 0.6 vs. 87.9 ± 1.1%, respectively; P = not significant).

