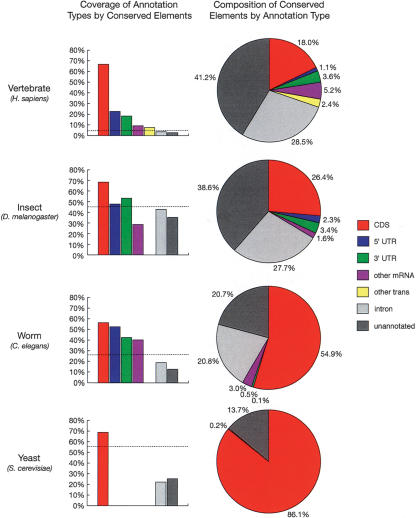
Figure 3.
Fractions of bases of various annotation types covered by predicted conserved elements (left) and fractions of bases in conserved elements belonging to various annotation types (right). Annotation types include coding regions of known genes (CDS), 5′ and 3′ UTRs of known genes, other regions aligned to mRNAs or spliced ESTs from GenBank (other mRNA), other transcribed regions according to data from Phase 2 of the Affymetrix/NCI Human Transcriptome project (other trans; see Methods), introns of known genes, and other regions (unannotated). All annotations were for the reference genome of each species group and all fractions were computed with respect to these genomes (see Methods). Dashed lines in column graphs indicate expected coverage if conserved elements were distributed uniformly. Transcriptome data was available for the vertebrates only, and UTRs and other mRNAs were omitted for yeast because of sparse data. Note that these graphs change somewhat (but not dramatically) under alternative calibration methods (see Supplemental material).

