Figure 4.
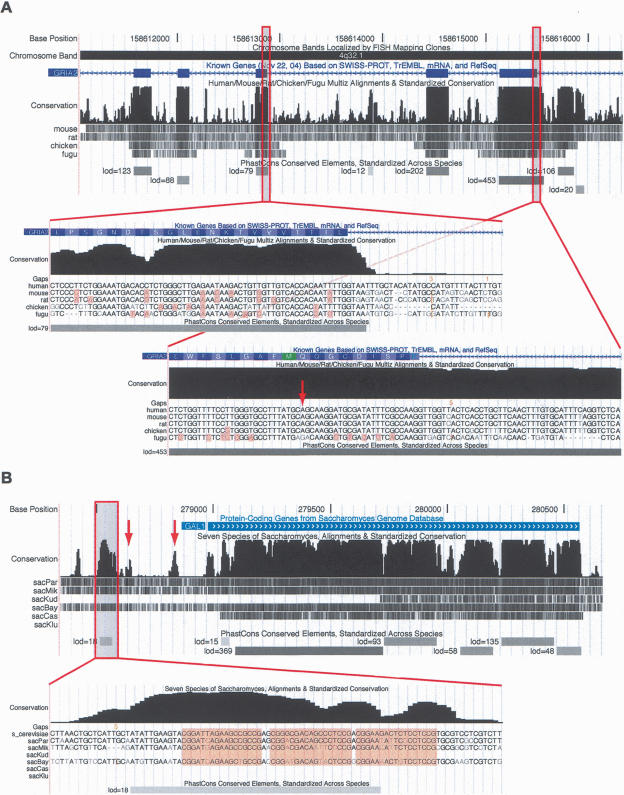
Screen shots of the conservation tracks in the (A) human and (B) S. cerevisiae UCSC Genome Browsers. Each conservation track has two parts, a plot of conservation scores, and beneath it, a display showing where each of the other genomes aligns to the reference genome. (Darker shading indicates higher BLASTZ scores; white indicates no alignment.) A separate track labeled “PhastCons Conserved Elements” shows predicted conserved elements and log-odds scores. In A, exons 7–11 of the RNA-edited human gene GRIA2 are shown. Peaks in the conservation plot generally correspond to exons and valleys to noncoding regions, but a 158-bp conserved noncoding element can be seen near the 3′ end of exon 11. This conserved element includes the editing complementary sequence (ECS) of the RNA editing site in exon 11. The displays seen when zooming in to the base level at a typical exon (left) and in the region of the RNA editing site (right; see arrow) are shown as insets. On the left, several synonymous substitutions are visible (highlighted bases) and the elevated conservation abruptly ends after the splice site, while on the right, there are fewer synonymous substitutions and the elevated conservation extends into the intron. In the base-level display, the vertical orange bars and numbers above them indicate “hidden” indels and their lengths—i.e., deletions in the human genome or insertions in other genomes. In B, the S. cerevisiae GAL1 gene and 5′-flanking region are shown. Strong cross-species conservation can be seen in the regulatory region upstream of the promoter, as well as in the protein-coding portion of the gene. The conserved element shown at bottom overlaps three GAL4-binding sites (highlighted in base-level view). A fourth GAL4-binding site also is reflected by a small bump in the conservation scores (left arrow), as is the promoter itself (right arrow).

