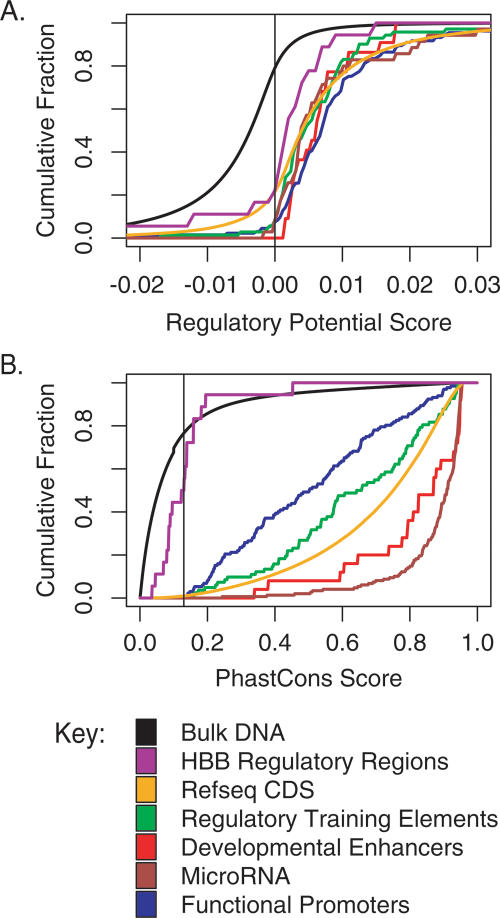
Figure 3.
Cumulative distributions of RP and phastCons scores in functional regions compared to the total aligned genomic DNA. The cumulative fraction with a maximal score below a scoring threshold for RP (A) and phastCons (B) is shown for each of six sets of functional sequences (colored lines). The purple line is for the CRMs in the HBB gene complex, gold is for the RefSeq coding exons (Pruitt and Maglott 2001), green is for the regulatory element training set (Elnitski et al. 2003), red is for a set of developmental enhancers (Plessy et al. 2005), brown is for miRNAs (Griffiths-Jones 2004), and blue is for functional promoters (Trinklein et al. 2003). The evaluation is based on the highest score within each interval for the functional elements. The cumulative distributions of scores for all the human–mouse–rat aligned positions are the black lines in each graph. For RP, every fifth base pair in alignments was scored (as the center of a 100-bp window), and for phastCons, all base pairs in alignments were scored. A vertical line is drawn at the optimal threshold for discriminating intervals (Table 2).

