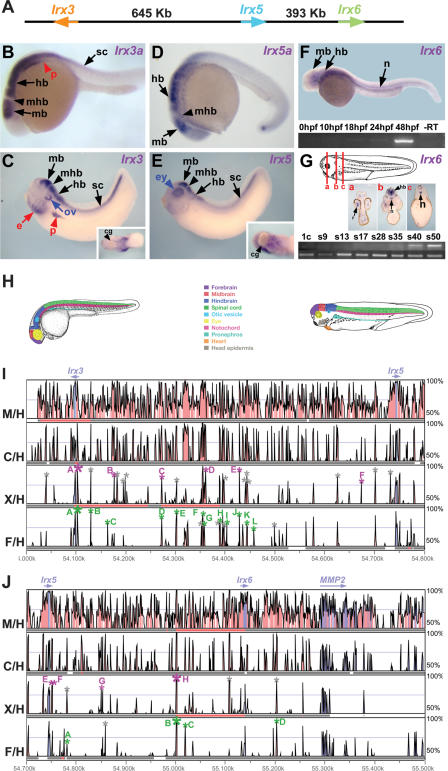
Figure 1.
Expression pattern of zebrafish and Xenopus IrxB genes and distribution of highly conserved non-coding regions within the IrxB locus. (A) Intergenic distances between the three IrxB genes in human chromosome 16. (B–G) Expression pattern of zebrafish and Xenopus IrxB genes. Lateral views of 24-hpf (B, D) or 48-hpf (F) zebrafish embryos, and stage 35 Xenopus embryos (C, E). (B) Zebrafish Irx3a is expressed in neural tissues and in the pronephros. (C) Xenopus Irx3 mRNA is detected in similar domains. In addition, it is detected in the ectodermal layer of the branchial arches and in the future heart region (inset). (D) Zebrafish Irx5a is present in neural tissues. (E) Xenopus Irx5 is expressed in the brain and in the neural tube in a pattern similar to that of Irx3. In addition it is expressed in the eye and in the future heart region (inset) but not in the otic vesicle, pronephros, or head epidermis. (F) In zebrafish, Irx6 is initially expressed at 48 hpf, as determined by RT-PCR (bottom). At this stage, in whole mounts Irx6 is detected in different neural domains and in the notochord (top). (G) Xenopus Irx6 mRNA onsets of expression occurs at stage 35 (bottom), as determined by RT-PCR. Compare Irx6 initial expression with the control Histone H4 mRNA shown below. (1c) One-cell stage; (s9–50) stages 9–50. Transverse sections of a stage 40 Xenopus laevis embryo at different levels, indicated by lines in drawing at top [(a) midbrain, (b) hindbrain, (c) spinal cord], show that Irx6 is expressed in the nervous system and in the notochord. (mb) Midbrain; (hb) hindbrain; (mhb) midbrain–hindbrain boundary; (sp) spinal cord; (ov) otic vesicle; (e) ectodermal layer of the branchial; (ey) eye; (p) pronephros; (cg) cement gland; (n) notochord. (H) Color-coded schematic representation of the zebrafish and Xenopus regions with IrxB gene expression. (I, J) VISTA view of the occurrence of conserved sequence domains in the gene deserts between the Irx3 and the Irx5 (I) or Irx5 and Irx6 (J) genes from vertebrate IrxB clusters. Shown from top to bottom are mouse vs. human (M/H), chick vs. human (C/H), Xenopus tropicalis vs. human (X/H), and Fugu vs. human (F/H) global alignments. Colored peaks (purple, coding; pink, non-coding) indicate regions of at least 100 bp and 75% similarity. Gray, green, and magenta asterisks mark the amplified genomic regions with no enhancer activity, with enhancer activity in zebrafish, and with enhancer activity in Xenopus, respectively. Letters in the colored peaks are referred to in the panels shown in Figure 2 (F/H row in I), Figure 3 (X/H row in I), and Figure 4 (F/H and X/H rows in J).

