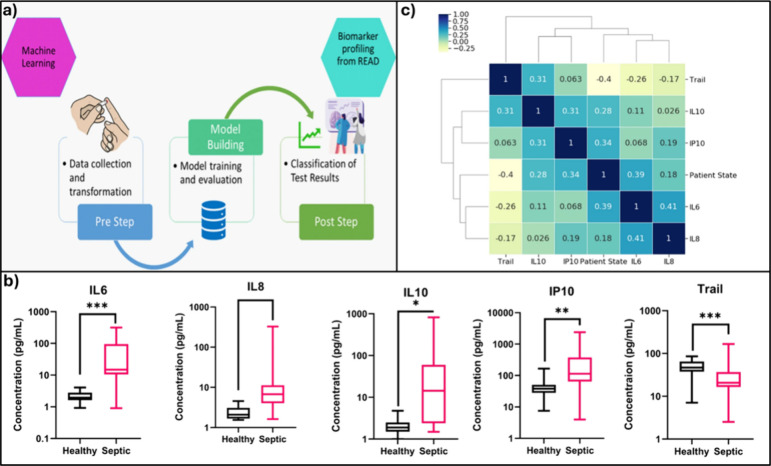
Figure 6.
(a) Machine learning model building process flow. (b) Comparing the healthy control vs septic patient samples for IL-6, IL-8, IL-10, IP-10, and Trail. (c) Correlation matrix with heatmap and cluster map showing relation between the study biomarkers and patient state. reprinted with permission from ref (76). Copyright Nature, 2021, under a Creative Commons license agreement (https://creativecommons.org/licenses/by/4.0/).

