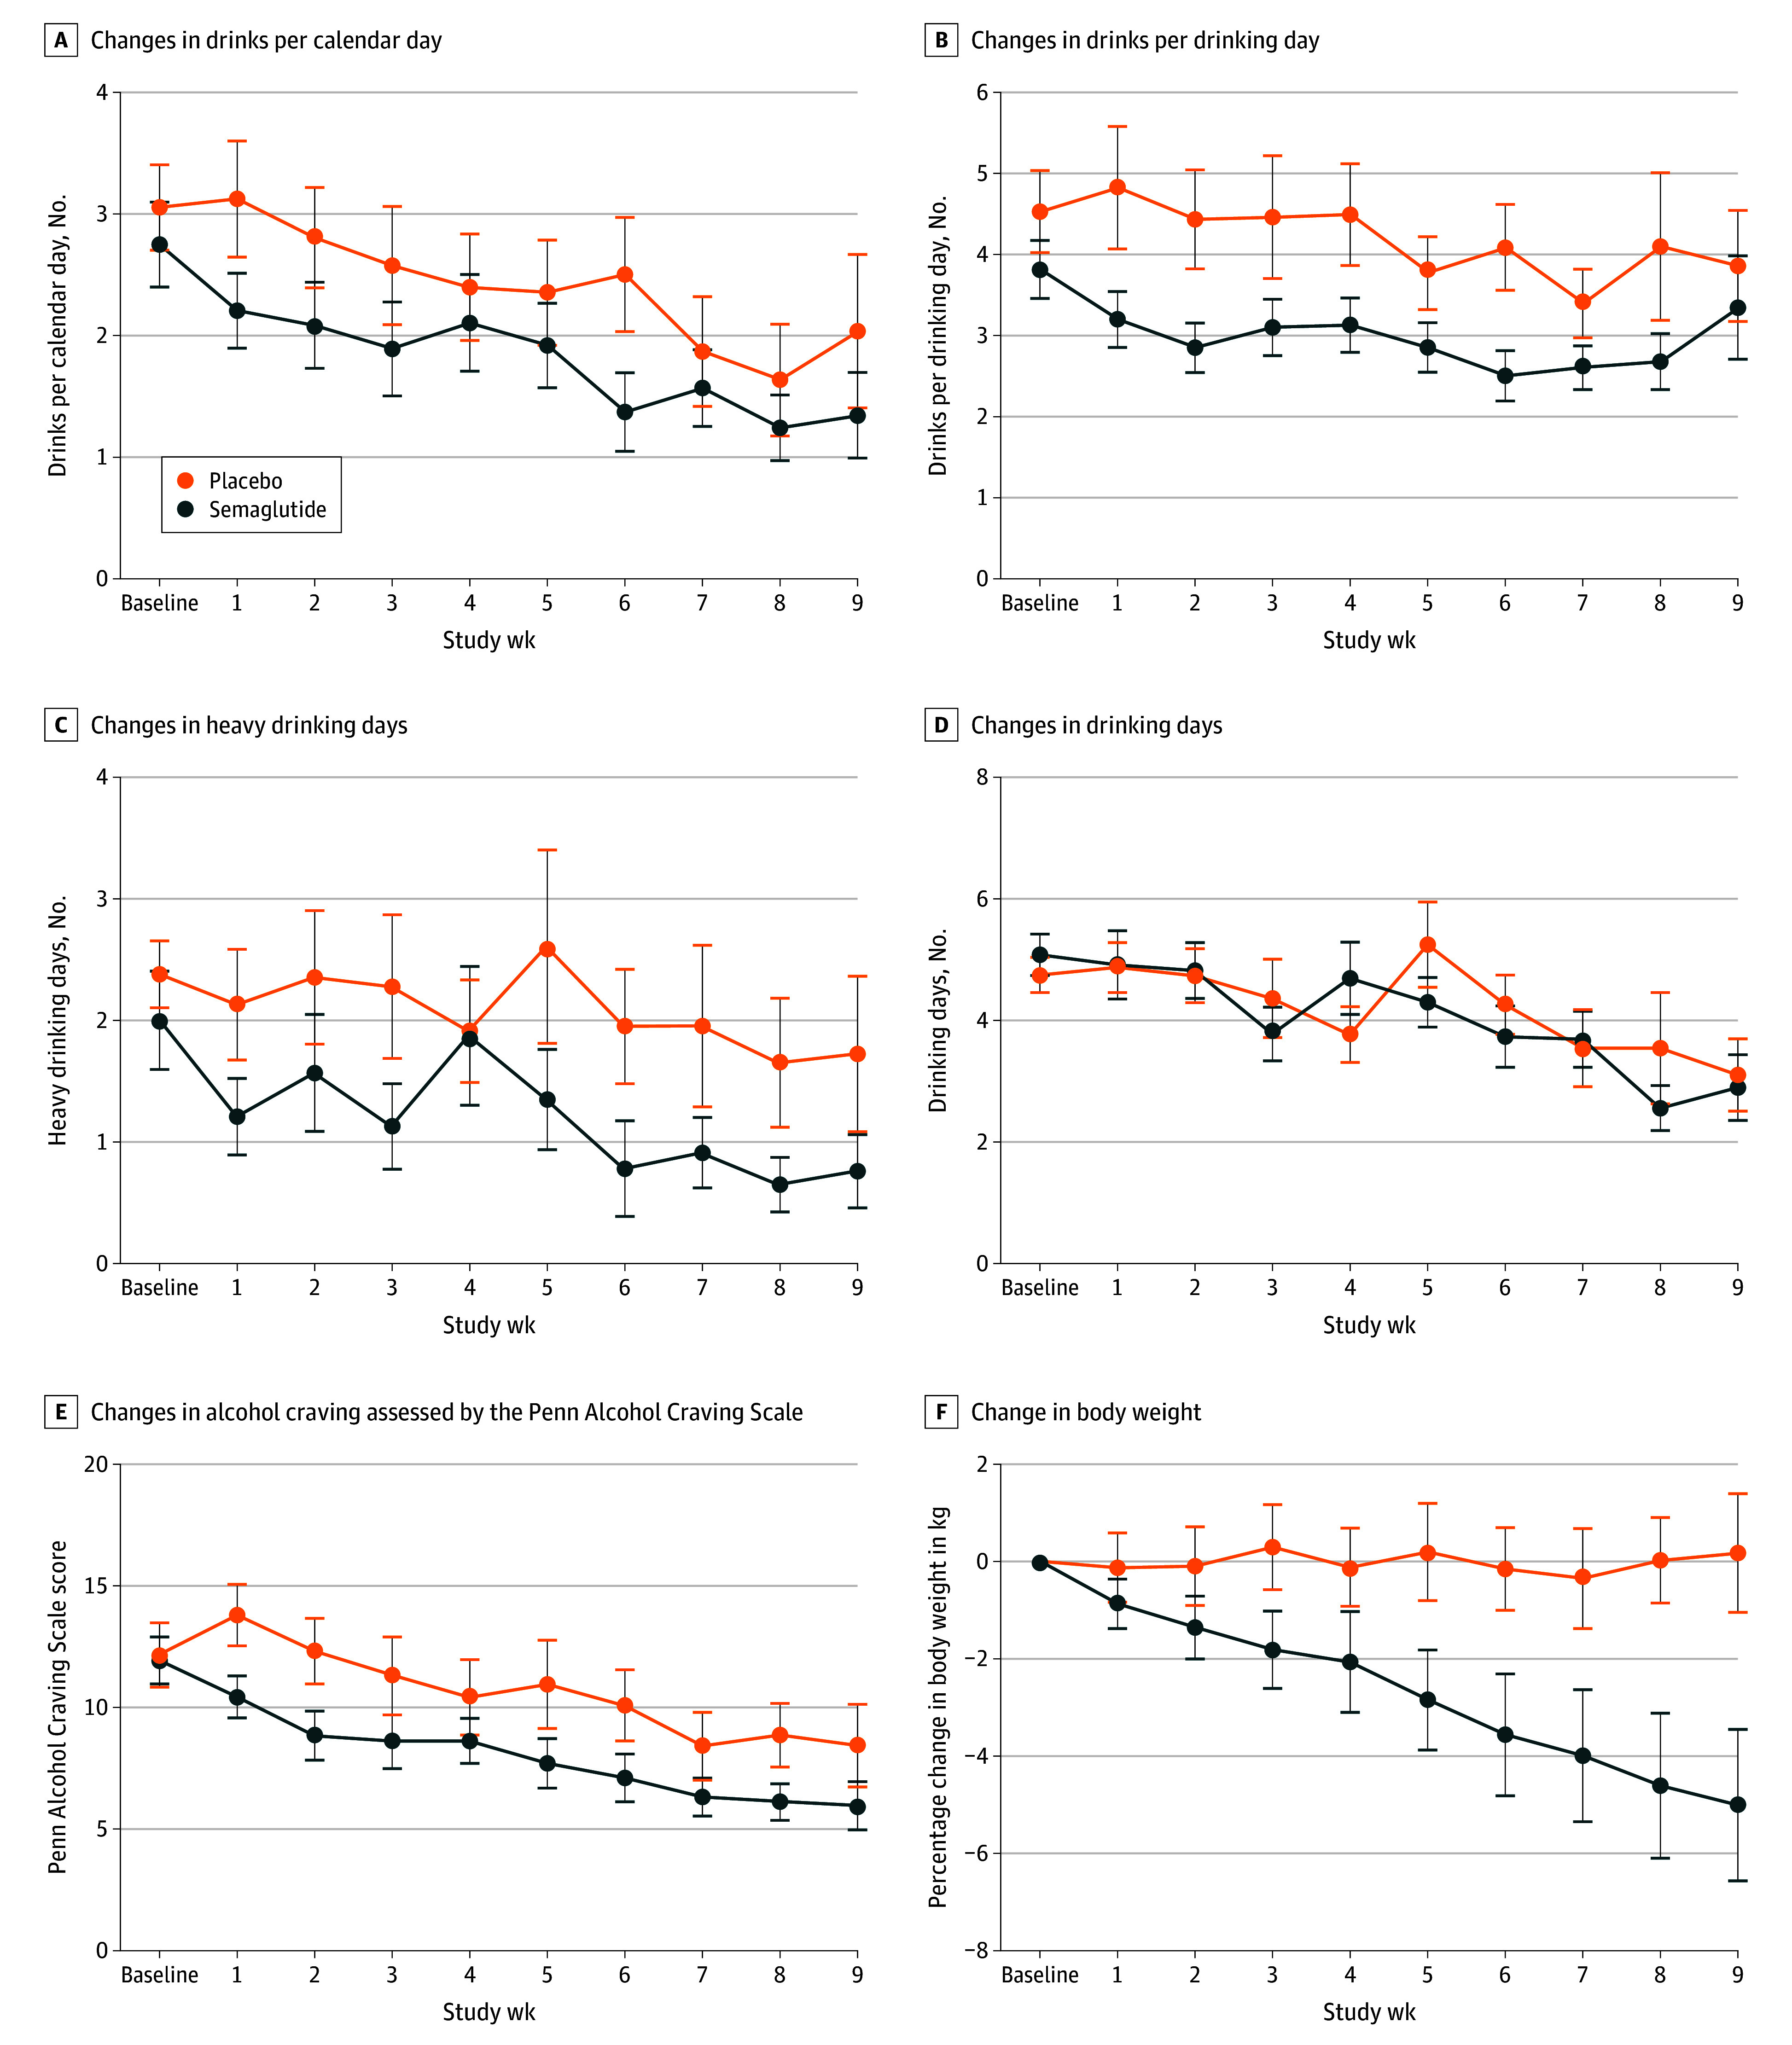
Figure 3. Prospective Changes in Weekly Alcohol Outcomes.

A, n = 39-48 across weeks (18-24 in the placebo group and 21-24 in the semaglutide group). B, n = 31-48 (15-24 in the placebo group and 16-24 in the semaglutide group). C, n = 39-48 (18-24 in the placebo group and 21-24 in the semaglutide group). D, n = 39-48 (18-24 in the placebo group and 21-24 in the semaglutide group). E, n = 41-48 (19-24 in the placebo group and 22-24 in the semaglutide group). F, n = 41-48 (19-24 in the placebo group and 22-24 in the semaglutide group). Alcohol craving was measured via the Penn Alcohol Craving Scale (0-30). Data points depict group means and standard errors for weekly measurements of the outcome. Medication commenced at week 1. Weekly time points indicate data collected at the end of the week following that week’s injection (eg, week 1 drinking data were measured at week 2 and reflect the week following the week 1 injection).
