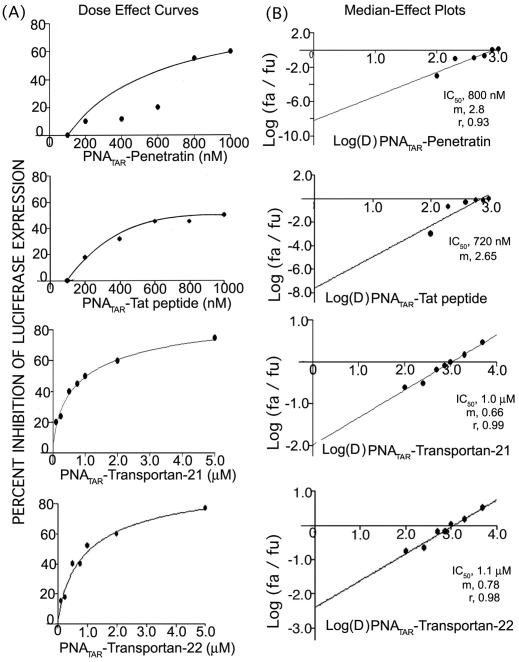
Figure 5.
(A) Dose–effect curve for antiviral efficacy of PNATAR–penetratin, PNATAR–tat-peptide PNATAR–transportan-21 and PNATAR–transportan-22 conjugates. CEM cells were infected with VSV-G pseudotyped S1 strain of HIV-1 and grown in the presence of increasing concentrations of PNATAR–penetratin and PNATAR–tat-peptide (0–1000 nM). Cells were harvested, lysed and assayed for luciferase expression 48 h post infection. The effect PNATAR–peptide concentrations on the luciferase expression was analyzed using the Calcusyn software (Biosoft). (B) Median-effect Plot: The IC50 values determined from the ratio of log of luciferase expression in treated cells (fa) and untreated cells (fu) as a function of the log concentration of PNATAR–penetratin, PNATAR–tat-peptide, PNATAR–transportan-21 and PNATAR–transportan-22 conjugates were 0.8, 0.70, 1.0 and 1.1 μM, and the linear correlation coefficients, r, were 0.93, 0.87, 0.99 and 0.98, respectively.

