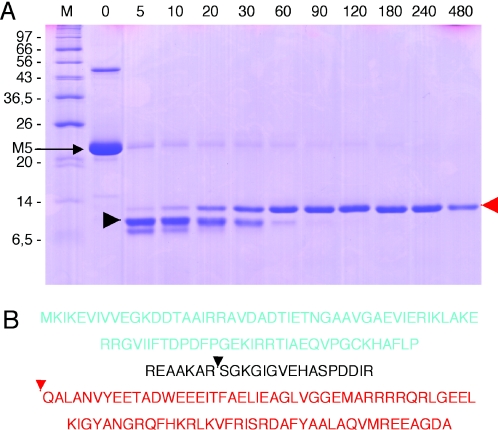
Figure 6.
Limited trypsin proteolysis of RNase M5. (A) SDS–polyacrylamide gel showing trypsin digestion products. The digestion times are given in minutes above the gel. The migration positions of the molecular weight markers (M) are indicated to the left of the gel. The triangles indicate species analysed by N-terminal sequencing (red) and mass spectroscopy (both red and black). (B) Sequence of B.stearothermophilus RNase M5 indicating the positions of trypsin cleavage. The Toprim domain is in blue lettering; the C-terminal trypsin resistant domain is in red. The positions of the red and black triangles show the N-termini of the corresponding species in (A).

