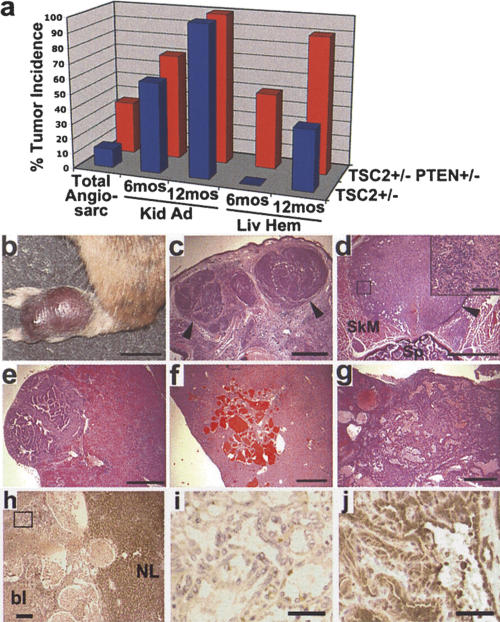
Figure 2.
Enhanced angiosarcomas and liver hemangiomas in Tsc2+/- Pten+/- mice. (a) Summary graph of the incidence of TSC-related tumors in Tsc2+/- and Tsc2+/- Pten+/- mice. See text for details. (b) Macroscopic view of a typical angiosarcoma on the paw of a Tsc2+/- Pten+/- mouse at 40 wk. (c) A section from the tumor in b. (d) An angiosarcoma found adjacent to the spine of a Tsc2+/- Pten+/- mouse. (SkM) Skeletal muscle; (Sp) spine. The boxed region is shown at high magnification in the inset. (e) Kidney adenoma from a Tsc2+/- Pten+/- mouse at 6 mo. (f,g) Typical liver hemangioma from a 12-mo-old Tsc2+/- mouse (f) compared with an example of the lesions found in Tsc2+/- Pten+/- mice (g). (c-g) H&E-stained tumors. (c-e) Arrowheads point to tumor borders. (h) Anti-TSC2 staining of a Tsc2+/- Pten+/- liver hemangioma and adjacent normal liver (NL). The staining within the vascular lesion is blood (bl). (i) High-magnification view of the box from h, demonstrating loss of TSC2 staining within the endothelial cells comprising the liver hemangioma. (j) Maintenance of PTEN expression in a Tsc2+/- Pten+/- liver hemangioma. Bars: b, 1 cm; c-g, 1 mm; d, inset, 100 μm; h, 200 μm; i,j, 40 μm.

