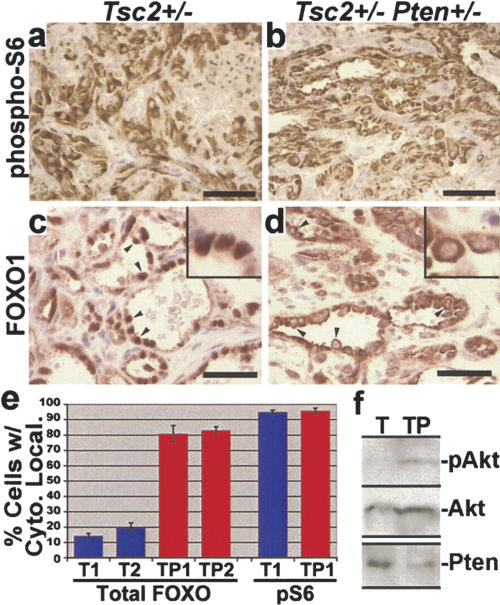
Figure 3.
High phospho-S6 levels and differential FOXO1 localization in liver hemangiomas from Tsc2+/- and Tsc2+/- Pten+/- mice. (a,b) A representative example of high phospho-S6 staining within a Tsc2+/- liver hemangioma (a) and a Tsc2+/- Pten+/- liver hemangioma (b), both from mice aged 12 mo. (c-e) Differential localization of FOXO1 in the endothelial cells of Tsc2+/- and Tsc2+/- Pten+/- liver hemangiomas. A representative example of the nuclear localization of FOXO1 in lesions from Tsc2+/- mice (c), in contrast to the predominantly cytoplasmic localization in those from age-matched (12 mo) Tsc2+/- Pten+/- mice (d) (arrowheads point to examples of this localization; insets, 1000× magnification). Bars: a-d, 40 μm. (e) Quantification of endothelial cells from liver hemangiomas showing more cytoplasmic FOXO1 than nuclear. Three hemangiomas per liver for two different Tsc2+/- (T1 and T2) and Tsc2+/- Pten+/- (TP1 and TP2) mice (all aged 12 mo) were examined. Nuclear/cytoplasmic localization in each endothelial cell positive for FOXO1 staining was scored within these lesions (>100 positive cells counted per lesion). Data are graphed as the mean percentage of cells per lesion exhibiting greater cytoplasmic than nuclear FOXO1 staining (error bars indicate standard deviation). P < 0.0001 for all comparisons between Pten+/- and Tsc2+/- Pten+/- data sets. As a control, cytoplasmic phospho-S6 (pS6) staining from adjacent sections of the same lesions was scored. (f) Crude lysates were prepared from liver hemangioma tissue and were analyzed by immunoblotting, as indicated. The total Akt blot was performed after stripping of the phospho-Akt (S473) blot. Representative samples from two of each genotype are shown.

