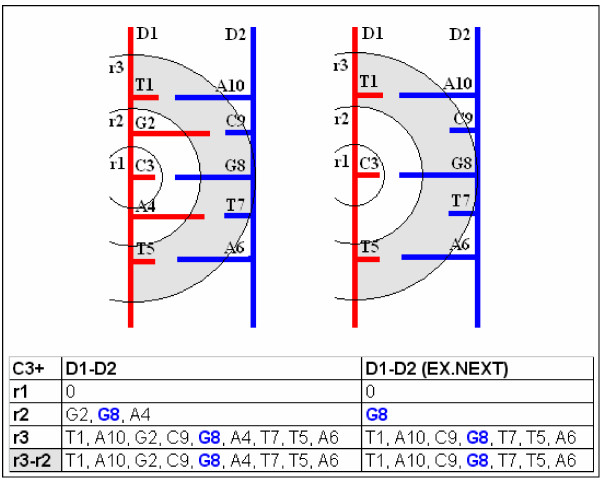
Figure 8.
Effect of monitoring radius on detection of residue co-locations in a dsDNA. Residue Co-locations are indicated in a dsDNA (D1-D2). Circles show distances (r1, r2, r3) from the C1' atom of a cytosine (C3). Residue co-locations ware detected by SeqX tool and summarized in the table. The number of detected thymine (T), guanine (G), adenine (A) depended on the radius. Shaded circle indicate area between r3 and r2 radius. G8, the expected complementary base to C3 was most selectively found using r2 radius and Ex. +/- 1 option which excluded closest neighbors to C3 in D1 from the detection.

