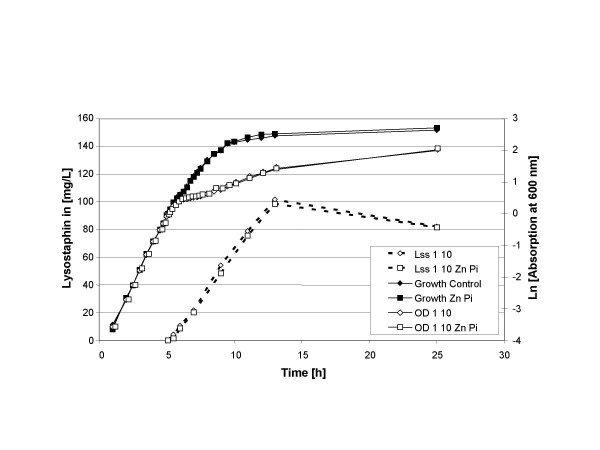
Figure 3.
Influence of zinc and phosphorus (Zn Pi) on growth, induction and lysostaphin production. Growth of the culture is indicated with continuous lines. Production of lysostaphin is indicated with broken lines. The cells are induced for lysostaphin (Lss) production at OD600 = 1 with 10 ng/mL nisin. [OD 1 10] or [Lss 1 10] indicate conditions for growth or lysostaphin production.

