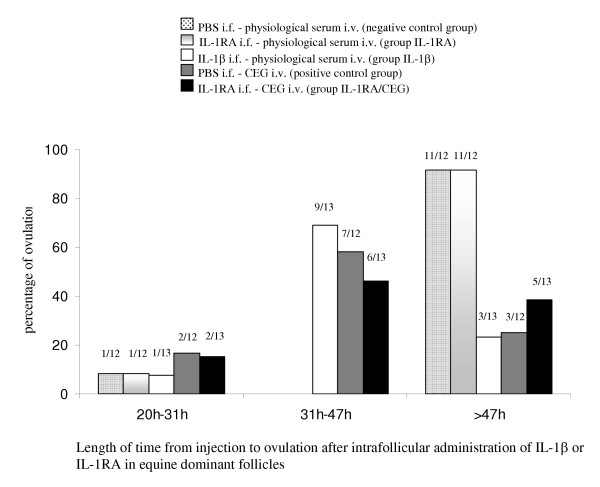
Figure 1.
Length of time from injection to ovulation after intrafollicular administration of IL-1β or IL-1RA in equine dominant follicles. For each group, histograms represent the percentage of mares that ovulated during each time interval. The proportion of mares is indicated on the top of each histogram. The distribution of the time of ovulation was not significantly different between the positive control group and the IL-1β group. In the negative control group and in the IL-1RA group, the distribution of the time of ovulation was significantly different from that in the positive control group and in the IL-1β group. In the IL-1RA/CEG group, this distribution was not significantly different from that in the positive control group and the IL-1β group but differed significantly from that in the negative control group and in the IL-1RA group.

