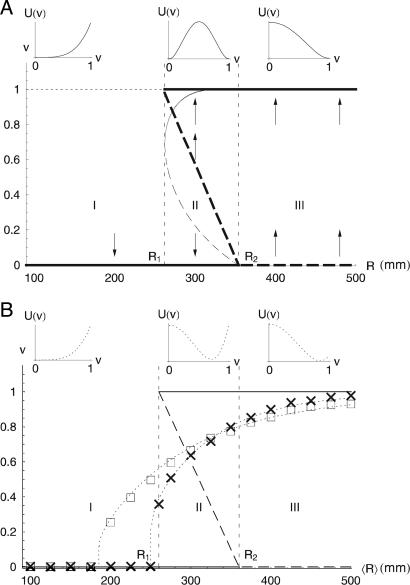
Fig. 2.
Stable and unstable states of the system. (A) Deterministic stable (solid thick lines) and unstable (dashed thick lines) states of Eq. 2 with R1 = 260 mm and R2 = 360 mm. The plots on the top represent the shapes of the deterministic potentials, U(v), associated with the different regimes of the dynamics. The arrows indicate the convergence toward a stable state. The thin, curved line represents stable (solid) and unstable (dashed) states of the growth-death model with k = 2 and B = 20 (〈s〉v=0 and 〈s〉v=1 depend on R as in Fig. 1B). (B) Noise-induced statistically stable states of the stochastic dynamics. Numerically calculated values of the modes of v (from Eq. 2) are shown with crosses (σR = 0.4〈R〉) and squares (σR = 0.6〈R〉). The thin dotted lines show the modes of v analytically calculated from Eq. 4 by using equation 25 in ref. 28. The agreement between numerical and analytical solutions suggests that c = c+ is a suitable mathematical approximation for the calculation of the modes of v. The stochastic potential functions associated with Eq. 4 are shown (dotted lines) in the plots on the top for the cases of 〈R〉 = 150, 310, and 410 mm, with σR = 0.6〈R〉. The shapes of deterministic and stochastic potentials indicate the emergence of noise-induced stability.

