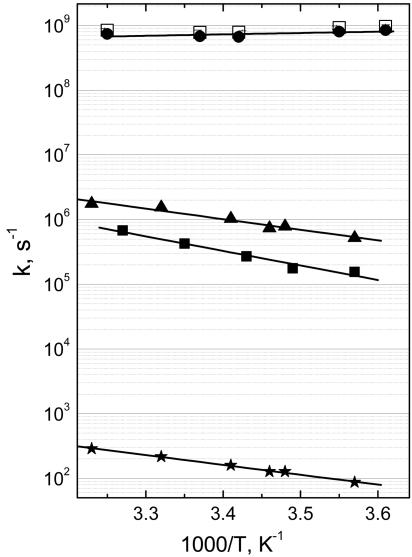
Fig. 3.
Temperature dependence of the ET and CO migration phases in cytochrome c oxidase. The observed rate constant of nanosecond ET in the mixed-valence state is shown as open squares, and the calculated forward heme a→a3 rate constant is shown as circles. Observed rate constants of CO migration from CuB in the fully reduced (triangles) and mixed-valence (filled squares) states of the enzyme and CO rebinding to heme a3 in the fully reduced state (stars) were fitted to the Arrhenius expression k = Ae-Ea/kBT, yielding activation energies Ea of 330 ± 30, 450 ± 40, and 306 ± 10 meV and preexponential factors A of 1011.5 ± 0.5, 1013.1 ± 0.8, and 107.4 ± 0.2 s-1, respectively.

