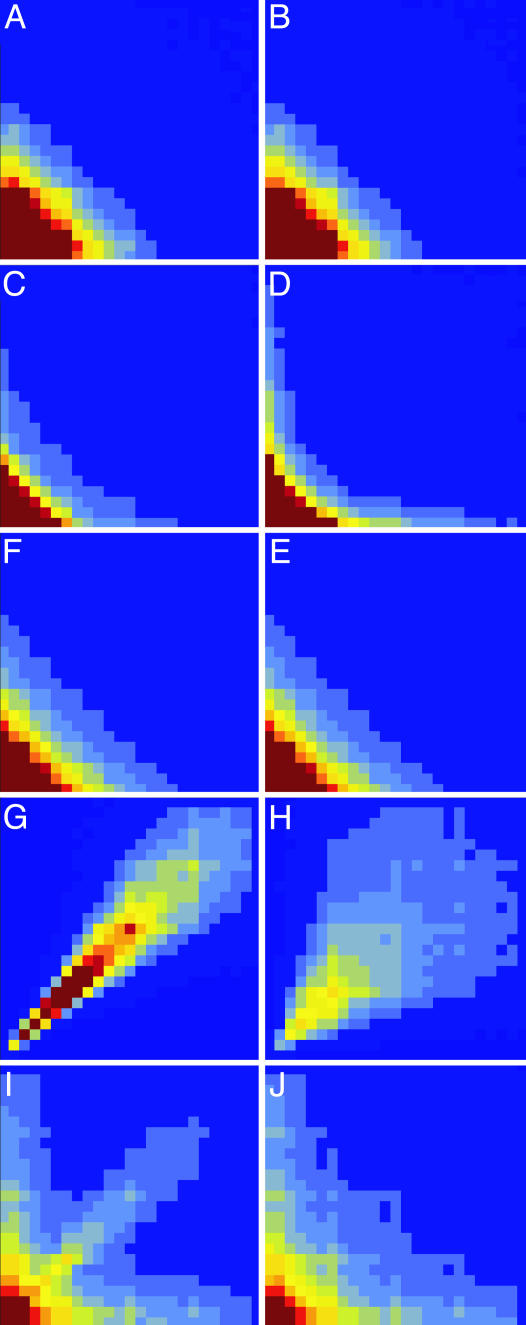
Fig. 2.
2D normalized histograms for the reduced MM model (A and B), the 2 × 2 model (C and D), the diffusive model (E and F), the stochastic oscillator model (G and H), and the superposition model (I and J). (Left) Histograms p(τj, τj + 1) for adjacent on times. (Right) Histograms p(τj, τj + 10) for on times separated by 10 cycles are displayed. The model parameters are k2 = 3.9 s-1 (A and B), k21 = 9.0 s-1, k22 = 1.36 s-1 k-2 = 1.03 s-1, kE′ = 0.13 s-1, kE = 0.0417 s-1 (C and D),  , k-2 = 1.2 s-1, λ = 0.1 s-1, θ = 0.8 (E and F), φm = 4, φp = 3.2, v0 = 2 s-1, λ = 0.0466 s-1, θ = 0.08, σ = 0.01 s-1, k-2 = 100 s-1 (G and H), and φm = 4, φp = 3.2, v0 = 2 s-1, λ = 0.0466, s-1, θ = 0.08, σ = 0.01 s-1, k2 = 7.8 s-1, k-2 = 100 s-1, kE′ = 200 s-1, and kE = 200 s-1 (I and J). The scales along vertical and horizontal axes are from 0 to 2 s (A–D), 0 to 5 s (E and F), and 0 to 1 s (G–J).

