Figure 5.
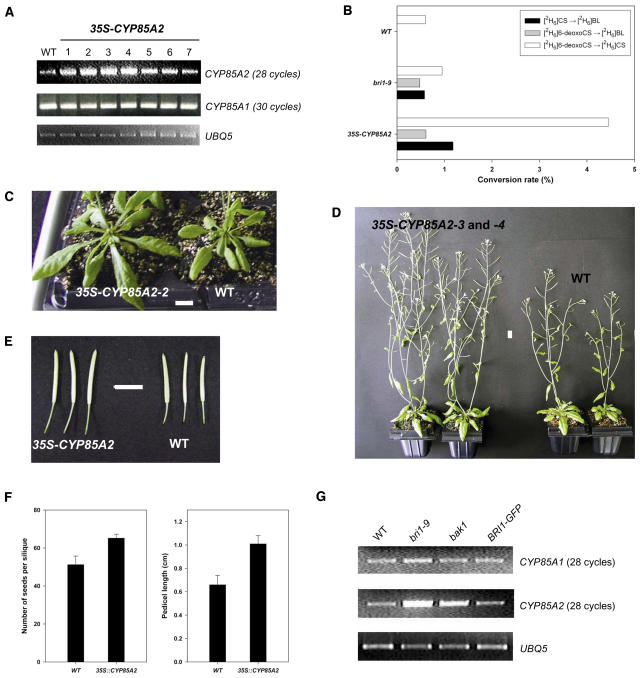
Biochemical Analysis and Phenotype of Arabidopsis CYP85A2 Overexpression Plants, 35S-CYP85A2.
(A) RT-PCR analysis of CYP85A2 and CYP85A1 mRNA levels in seven independent 35S-CYP85A2 lines.
(B) Result of feeding experiment on wild-type, bri1-9, and 35S-CYP85A2 plants using labeled BRs.
(C) Rosette leaves in 35-d-old 35S-CYP85A2 and wild-type (Col-0) plants. Bar = 1 cm.
(D) Inflorescence of 35S-CYP85A2 and wild-type plants. Bar = 1 cm.
(E) Siliques of 35S-CYP85A2 and wild-type plants. Bar = 1 cm.
(F) Comparison of the number of seeds per silique and pedicel length in 35S-CYP85A2 and wild-type plants. Error bars in the graph denote se (n > 30).
(G) RT-PCR analysis of CYP85A1 and CYP85A2 mRNA levels in wild-type, bri1-9, bak1, and BRI1-GFP plants. mRNA was isolated from 10-d-old seedlings. UBQ5 was used as a control.

