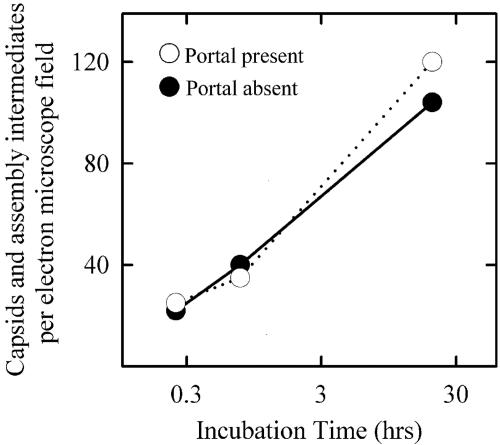
FIG. 2.
Time course for appearance of HSV-1 capsids and capsid assembly intermediates during in vitro capsid formation. The total number of completed capsids and capsid assembly intermediates were counted in electron micrographs, such as those shown in Fig. 1. Counts for each time point were made in one ×10,000 electron microscope negative. Note that the rate of appearance of assembly products was not affected by the presence of the portal in reaction mixtures.

