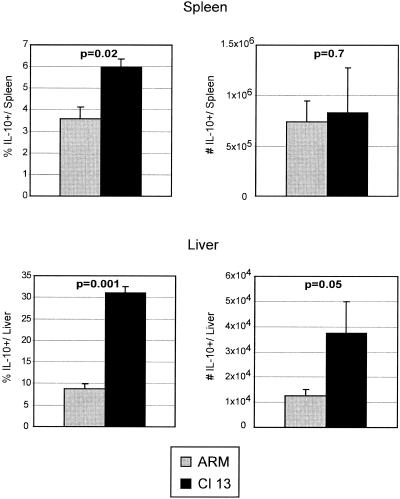
FIG. 4.
Increased IL-10 production during persistent infection. Spleen (top panels) and liver (bottom panels) cells from Armstrong-infected (ARM) or Clone 13-infected (Cl 13) animals were isolated 5 days postinfection. The percentage (left panels) and absolute number (right panels) of IL-10-producing SMARTA cells were analyzed by intracellular flow cytometry. Bar graphs represent the average ± standard deviation from three mice in each group and are representative of three experiments. The corresponding P values for statistically different groups are denoted on the graphs.

