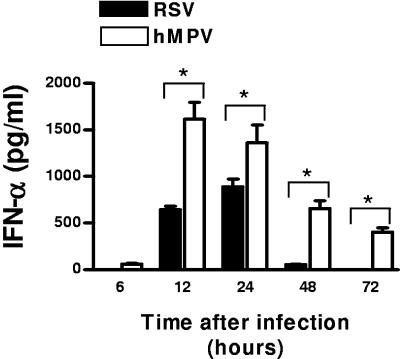
FIG. 7.
IFN-α production in lungs of mice infected with RSV or hMPV. BALB/c mice were infected with either RSV or hMPV (both at 107 PFU) and production of IFN-α was measured by ELISA in BAL samples at different time points. The bar graph represents mean ± standard error of the mean (n = 3 to 5 mice/group/time point). *, P < 0.05.

