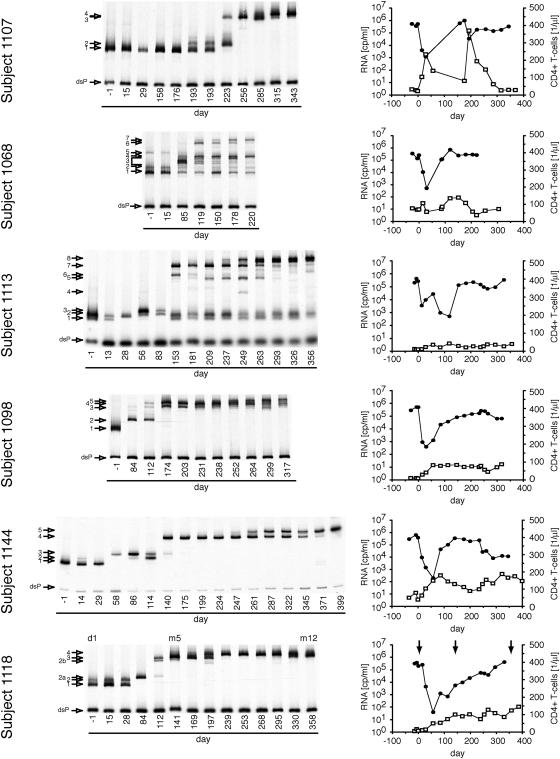
FIG. 1.
Dynamics of protease variants during ritonavir resistance evolution in subjects with a transient virus load reduction of greater than 300-fold. Dynamics were analyzed with a multiple site-specific HTA which displays mobility shifts in response to mutations at positions 46, 48, 54, 82, 84, and 90 in protease. Each band represents a protease variant and is assigned a number on the left. The position of the labeled probe strand annealed to a fully complementary strand is indicated (double-stranded probe; dsP). In addition, the viral load (filled circle) and the concentration of CD4+ T cells (open squares) are shown for each subject in the right column. Arrows in the viral load graphs indicate protease alleles that were introduced into molecular clones.

