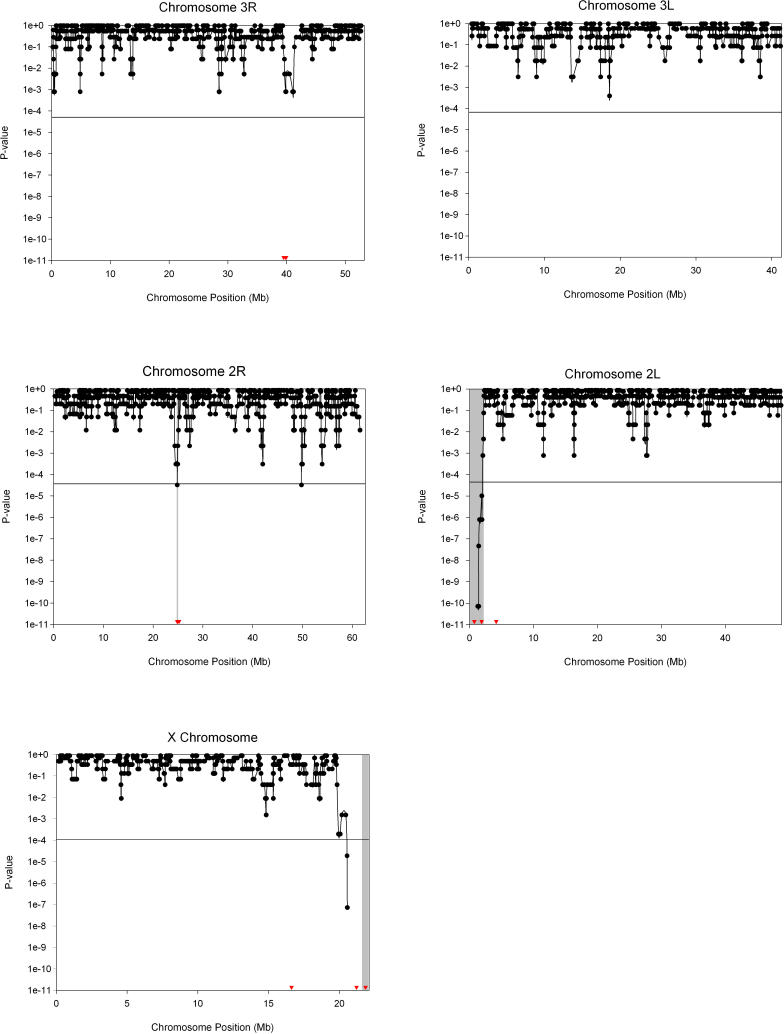
Figure 1. Differentiation between Forms.
The significance threshold shown is p = 0.05, Bonferroni-corrected for the number of windows tested per chromosome. The centromeres of Chromosomes 2 and 3 are located between the right and left arms, i.e., between each pair of graphs; the centromere of Chromosome X is located at the right end of the graph. Grey areas are divergent regions identified by our HMM. The grey region at the tip of Chromosome X appears to lie outside of the final window because the chromosomal position given for each window is the location of the central probe in that window; the final window on Chromosome X spans a large region because of low gene density. Sequenced loci are shown with red triangles; overlapping triangles on Chromosomes 3R and 2R obscure multiple sequenced loci (see text for details). 3L, left arm of Chromosome 3; 3R, right arm of Chromosome 3.

