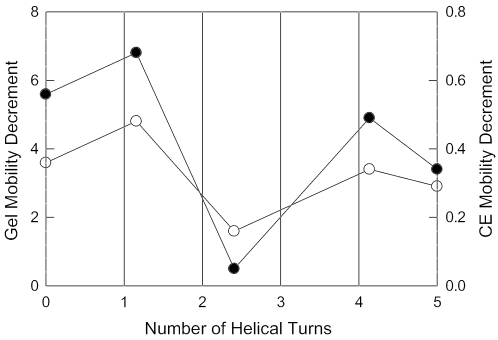
Figure 5.
Dependence of the gel and free solution mobility decrements of mutants containing single A- or T-tracts (fitted values) on the number of 10.4 bp helical turns between the initial A6-tract in the curvature module and subsequent A- and T-tracts. The symbols correspond to: closed circles, gel mobility decrements (left ordinate); open circles, free solution mobility decrements (right ordinate). Similar results are observed if the measured mobility decrements are plotted instead of the fitted values.

