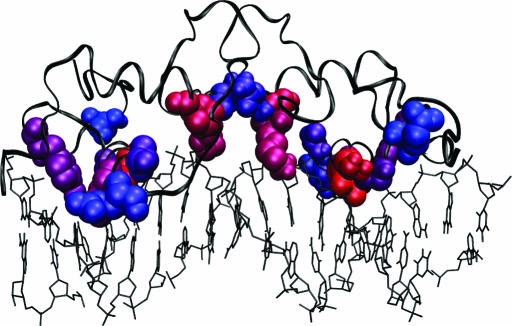
Figure 6.
Crystal structure of GCR bound to DNA (pdb:1R4R) (49). The ten predicted residues for the nuclear receptor family are shown in VDW representation. The top ranked residue is colored red and the tenth is colored blue, with the colors shifted stepwise from red to blue for residues two through nine. The protein is shown in ribbon representation (colored black) and the DNA in lines representation (black). Figure made using VMD (63).

