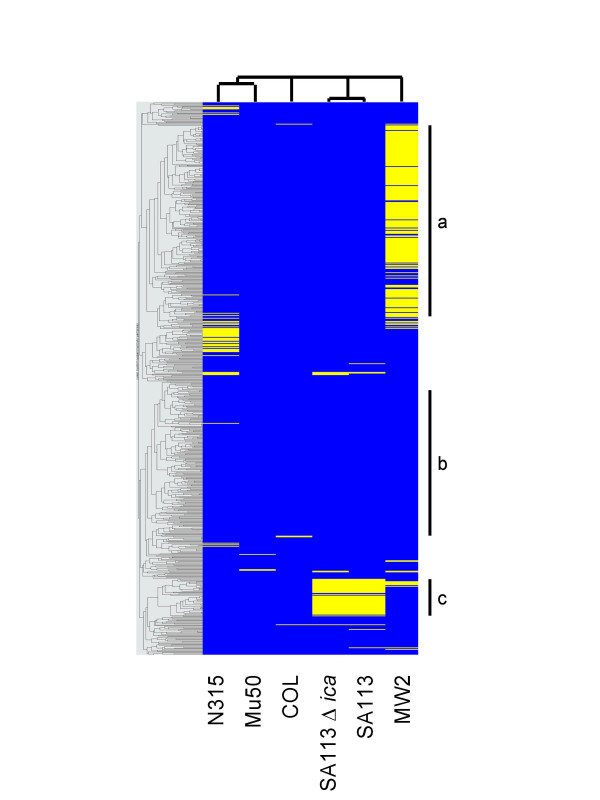
Figure 4.
Comparative genome hybridization using clustering analysis. Genomic DNA of each individual S. aureus strain was labelled with Cy3 and co-hybridized with equivalent amounts of Cy5-labelled genomic DNA pooled from N315, Mu50 and COL. Background-subtracted data were expressed as Log10 ratios and analyzed by two-way clustering using GeneSpring 6.1. Probes yielding positive and negative signals are shown in blue and yellow, respectively. The significance of black bars (a, b, and c) is indicated in the text. Note that the figure resolution does not allow visualising single probe differences but only clusters of probes.

