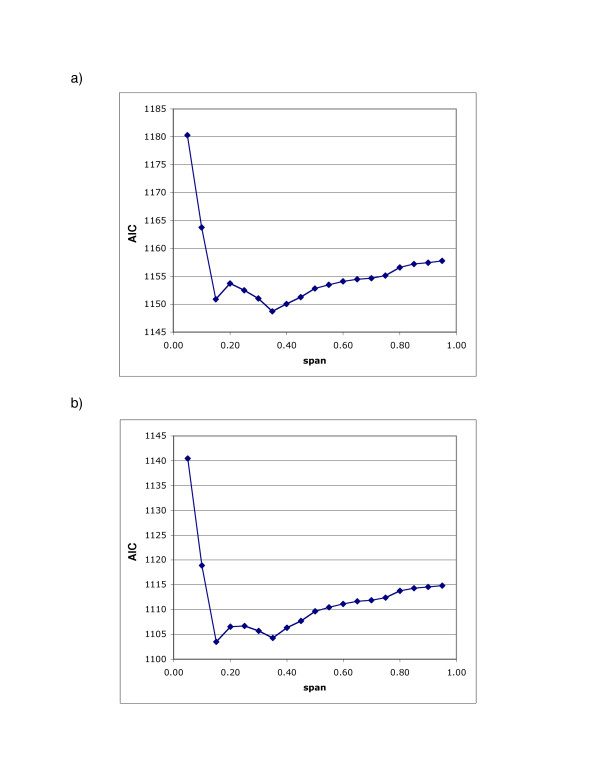
Figure 6.
AIC Curves for the Imputed and Non-Imputed Breast Cancer Maps. Adjusted, 20 years of Latency. a) AIC curve for the imputed map. b) AIC curve for the non-imputed map. Both curves have local minima at span sizes of 0.15 and 0.35. Although quite similar in magnitude, the AIC value at 0.35 is slightly smaller than the value at 0.15 for the imputed map; the reverse is true for the non-imputed map. From a statistical point of view, both span sizes appear appropriate.

