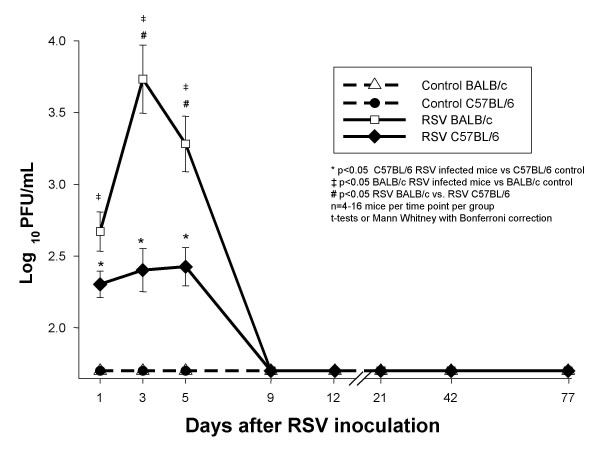
Figure 6.
RSV loads in BAL samples measured by the plaque assay method. Groups of 4–16 BALB/c (△) and C57BL/6 (●) mice per group per time point were inoculated intranasally with sterile 10% EMEM (control), and were compared with RSV A2 infected BALB/c (□) and C57BL/6 (◆) mice. Viral load was determined by HEp-2 plaque assay in BAL samples. Data are presented as mean ± SEM Log10 PFU/ml of BAL. p < .05, by t-test when data normally distributed, or by Mann-Whitney Rank sum test when data were not normally distributed.

