Figure 4.
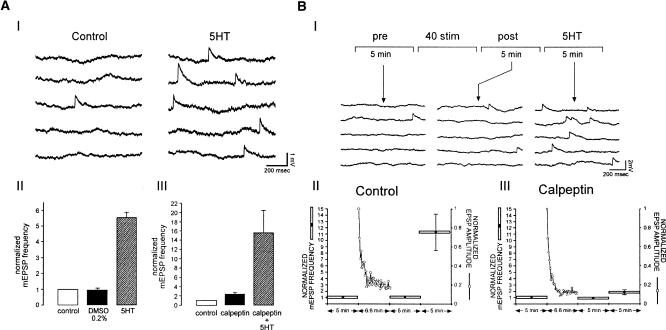
Effect of calpeptin on spontaneous release in rested and highly depressed synapses. The effects of calpeptin on spontaneous release of (A) rested and (B) highly depressed synapses were examined. (AI) In rested synapse, 10μM 5HT increases the frequency of spontaneous neurotransmitter release (compare control traces on the left to the traces on the right following 5HT application). (AII) Summary of the effects of 10 μM 5HT on the mean mEPSP frequency (n = 6). 5HT increases significantly the mEPSP frequency (right, P < 0.01; paired t-test). All values were normalized with respect to the control values. (AIII) Calpeptin alone enhances the mean rate of spontaneous release with respect to the control experiments, but this enhancement is not significant (n = 6, P > 0.05; paired t-test). In rested synapses, calpeptin does not inhibit 5HT-induced increases of the mEPSP frequency (right bar, n = 6. P < 0.05; paired t-test). (B) To evaluate the effect of calpeptin on spontaneous release of depressed synapses, we sampled the spontaneous release for 5 min before stimulation, after a train of 40 stimuli (at 0.1 Hz) and following the application of 10 μM 5HT. (BI) Examples of traces of spontaneous release recorded before stimulation (pre-), after stimulation (post-), and following 5HT application (5HT). Summary of mEPSP frequency measurements according to the protocol in BI. (BII) Controls (n = 6). (BIII) Cells incubated in 100 μM calpeptin for 15 min before the experiment (n = 6). Horizontal bars indicate the duration over which mEPSP frequency was sampled for each data point. mEPSP frequency is normalized with respect to the frequency in the control period of the experiment. The left y-axis shows normalized mEPSP frequencies. On the right, the ordinates indicate the normalized EPSP's amplitude. Note that in the control experiments, 5HT significantly increases the mEPSP frequency (P < 0.05; paired t-test). In contrast, the mEPSP frequency is only slightly increased in the presence of calpeptin (P > 0.05; paired t-test). Error bars represent SEM.

