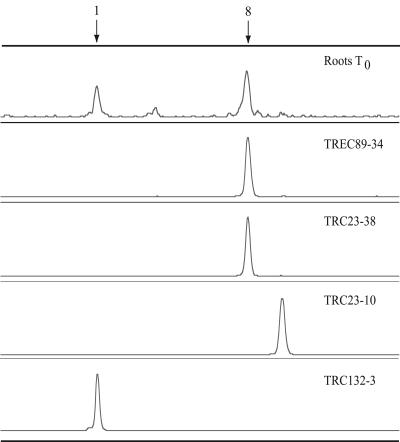
FIG. 4.
PCR-SSCP electropherograms of a crenarchaeal rhizoplane sample and clones recovered from the rhizoplane and root extract enrichment culture. For comparisons between samples, individual electropherograms were aligned on the basis of a common internal lane standard. The y axis represents relative fluorescence intensity, and the x axis represents the relative migration distance of the PCR-SSCP DNA fragment. Arrows indicate peaks corresponding to the two most abundant crenarchaeal phylotypes detected on the rhizoplane.

