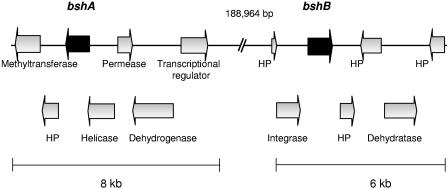
FIG. 1.
Schematic representation of the genetic organization of the bsh loci of L. acidophilus NCFM. Arrows indicate ORFs and the directions of transcription; bsh genes are represented by solid black arrows. Annotations of flanking genes are also indicated. HP denotes a hypothetical protein of unknown function. This representation is not drawn to scale.

