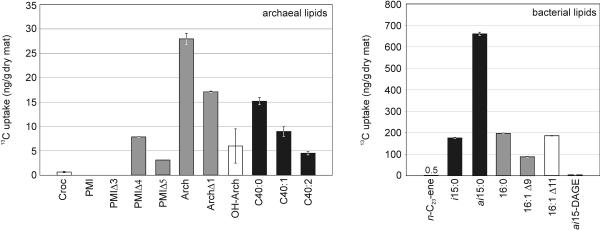
FIG. 3.
Net 13C uptake for selected compounds after completion of the experiment, calculated for 1 g (dry weight) of mat. The error bars indicate the maximum and minimum uptake of 13C using the analytical error for δ13C analyses. Calculations for PMIΔ4 and PMIΔ5 were based on a theoretical δ13C starting value of −90‰ (as observed for PMI) and concentrations measured at the end point. For abbreviations see the legend to Fig. 1. Different kinds of bars indicate the most likely source organisms of the lipid components (based on a previous study [3]), as follows: solid bars, ANME-1 associations; open bars, ANME-2 associations; gray bars, mixed and/or unknown sources.

