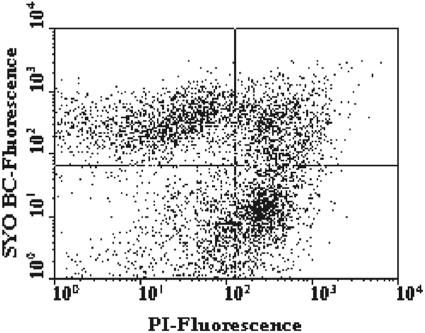
FIG. 1.
FCM analysis of a fecal sample stained with SYTO BC and PI. The two-color dot plot discriminated between SYTO BC-stained viable cells (upper left quadrant), double-stained injured cells (upper right quadrant), PI-stained dead cells (lower right quadrant), and STYO BC- and PI-stained injured cells. Results were obtained with the FACSCalibur.

