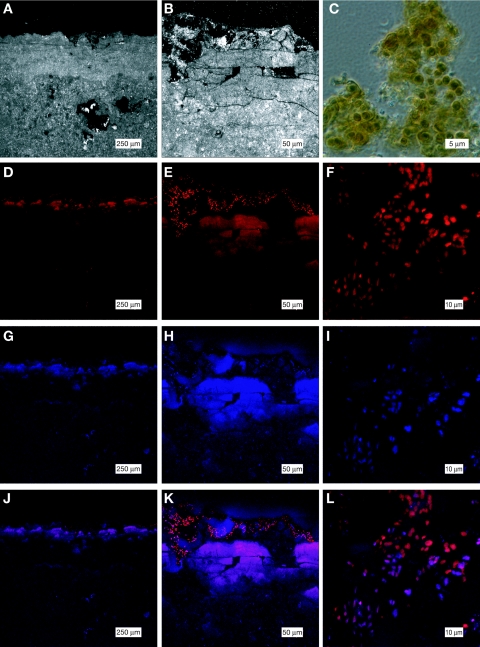
FIG. 7.
Cyanobacterial cells imaged in thin sections of the surface layer of HPDOM by LSCM shown at three magnifications. The top row shows reflected light images (A and B) and a phase-contrast image of cyanobacterial cells scraped from the surface of HPDOM (C). (D to F) Row 2 shows phycocyanin fluorescence (F 633/685). (G to I) Row 3 shows phycoerythrin fluorescence (F 543/590). (J to L) Row 4 shows the merge of images in rows 2 and 3.

