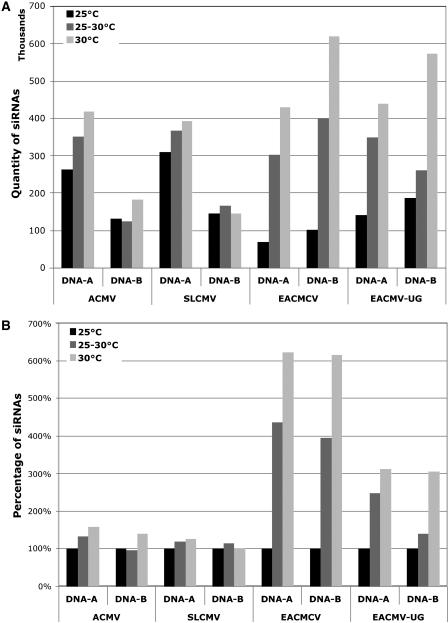
Figure 4.
A, Comparison of virus-derived siRNA accumulation for each of the DNA-A and DNA-B components of ACMV, SLCMV, EACMCV, and EACMV-[Ug] at 25°C, 25°C to 30°C, and 30°C temperatures. Values on the y axis represent the sum of intensities of signals (103). The x axis represents the DNA-A and the DNA-B components of ACMV, SLCMV, EACMCV, and EACMV-[Ug] at three temperatures: 25°C, 25°C to 30°C, and 30°C. B, Comparison of virus-derived siRNA accumulation for each of the DNA-A and DNA-B components of ACMV, SLCMV, EACMCV, and EACMV-[Ug] at 25°C, 25°C to 30°C, and 30°C temperatures, relative to the values at 25°C (100%). Values on the y axis represent the percentage of siRNAs relative to the value at 25°C for each DNA component and for each virus. The x axis represents the DNA-A and the DNA-B components of ACMV, SLCMV, EACMCV, and EACMV-[Ug] at three temperatures: 25°C, 25°C to 30°C, and 30°C.

