Figure 5.
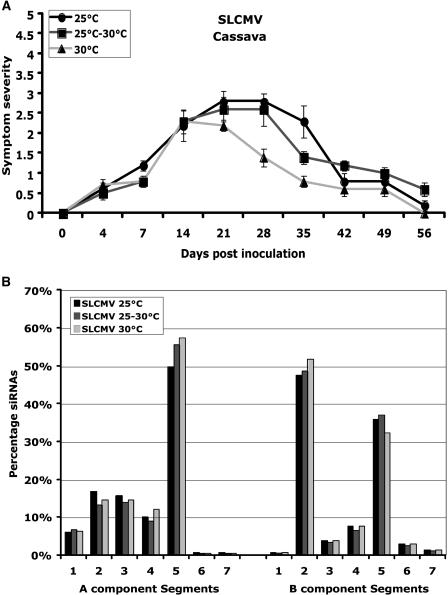
Effect of temperature on symptom severity of SLCMV on cassava, and the level and distribution of virus genome siRNAs in infected cassava plants. A, SLCMV symptom severity trend in cassava in three temperatures conditions: 25°C, 25°C to 30°C, and 30°C. Ten cassava plants were inoculated as five plants in two experiments. Bars in symptom severity curve indicate se values of 10 plants. B, Gel blots (first seven segments for DNA-A and second seven segments for DNA-B) were subjected to gel-blot hybridization using 5′-labeled virus-derived siRNAs purified from SLCMV-infected plants grown at 25°C, 25°C to 30°C, and 30°C. The intensity of signals in the blots was quantified and plotted into graphs. Values on the y axis represent the percentage of siRNAs derived from either DNA-A or DNA-B of SLCMV. Each bar represents the amount of siRNAs for respective DNA segments in comparison to the total amount of siRNAs either for DNA-A or DNA-B. Blots were quantified using image quant (IqMacV1.2) software. Numbers in the x axis indicate the PCR-amplified DNA fragments representing various regions of the SLCMV genome.

