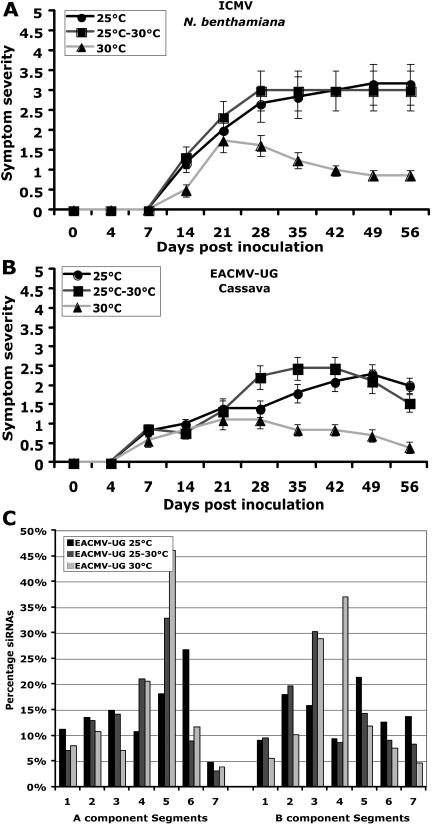
Figure 7.
Effect of temperature on symptom severity of ICMV in N. benthamiana and on EACMV-[Ug] infection in cassava, and the level and distribution of EACMV-[Ug] genome siRNAs in infected cassava plants. A and B, ICMV symptom severity trend in N. benthamiana (A) and EACMV-[Ug] in cassava (B) in three ranges of temperature: 25°C, 25°C to 30°C, and 30°C. Ten plants were inoculated as five plants in two experiments. Bars in symptom severity curve indicate se values of 10 plants. C, The level and distribution of virus-derived siRNA accumulation were assessed only in virus infection in cassava. Gel blots (first seven segments for DNA-A and second seven segments for DNA-B) were subjected to hybridization using 5′-labeled virus-derived siRNAs purified from EACMV-[Ug]-infected plants grown at 25°C, 25°C to 30°C, and 30°C. The intensity of signals in the blots was quantified and plotted into graphs. Values on the y axis represent the percentage of siRNAs derived from either DNA-A or DNA-B of EACMV-[Ug]. Each bar represents the amount of siRNAs for respective DNA segments in comparison to the total amount of siRNAs either for DNA-A or DNA-B. Blots were quantified using image quant (IqMacV1.2) software. Numbers in the x axis indicate the PCR-amplified DNA fragments representing various regions of the SLCMV genome.

