
Figure 5.
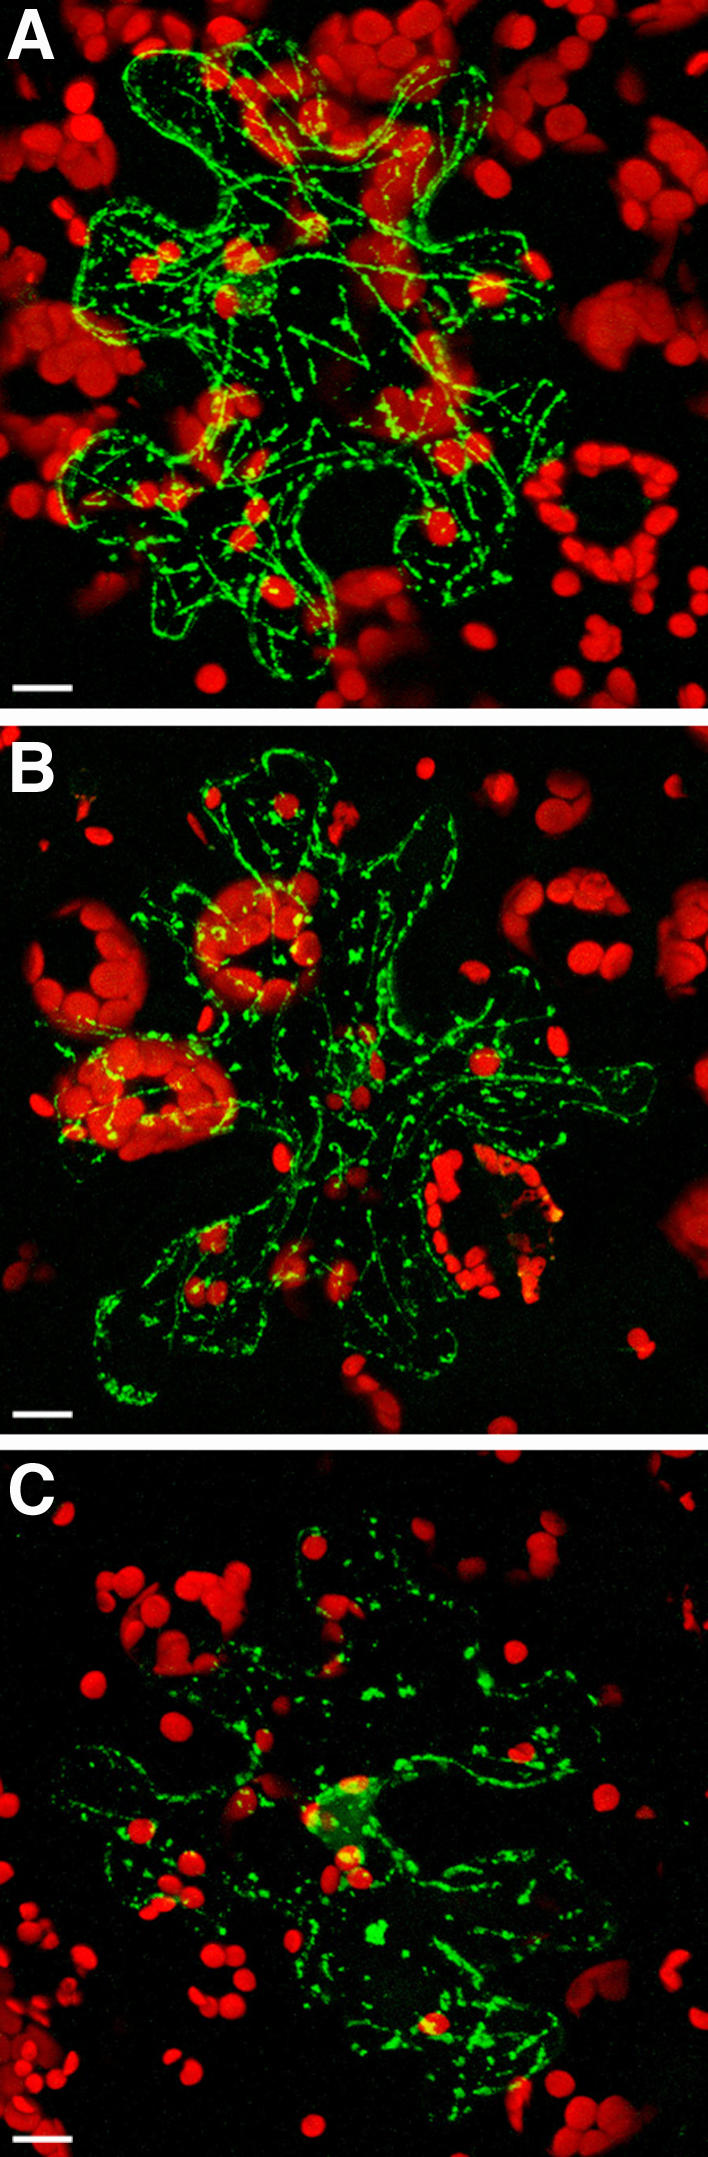
TMV MP associates with MTs in transgenic N. benthamiana plants overexpressing ZmCRT1. A, GFP-TMV MP in mock-treated tissue. B, GFP-TMV MP in tissue treated with 0.2 μM latrunculin A. C, GFP-TMV MP in tissue treated with 5 μm oryzalin. GFP signal is in green; plastid autofluorescence is in red. All images are projections of several confocal sections. Bars = 10 μm.