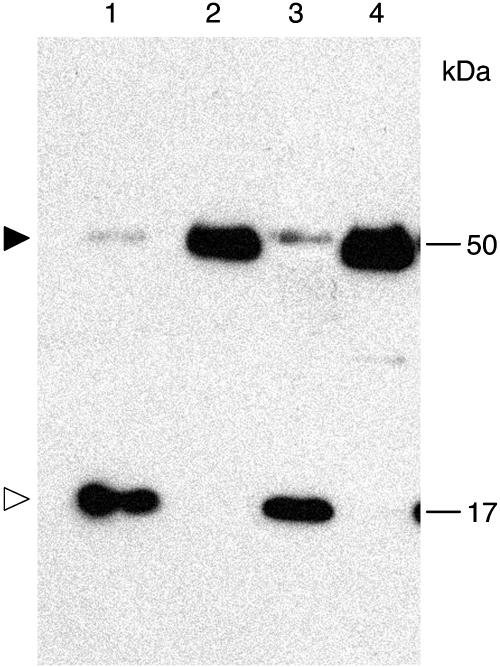
Figure 6.
Delayed cell-to-cell movement of TMV in transgenic N. benthamiana plants overexpressing ZmCRT1. Lane 1, Wild-type plants 2 d postinoculation; lane 2, transgenic plants overexpressing ZmCRT1 2 d postinoculation; lane 3, wild-type plants 7 d postinoculation; lane 4, transgenic plants overexpressing ZmCRT1 7 d postinoculation. Black and white arrowheads indicate positions of calreticulin and TMV CP, respectively. Molecular mass expressed in thousands of Daltons is indicated on the right.

