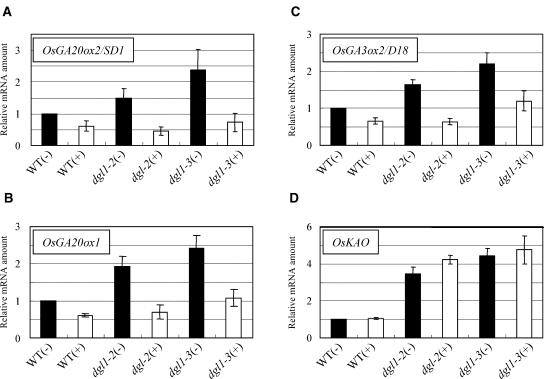
Figure 8.
Enhanced expression of GA biosynthetic genes in dgl1 and suppression by GA3 treatment. Quantitative RT-PCR was performed using primers specific for each GA biosynthetic gene (see “Materials and Methods”). The plants were treated with (+) 10−4 m GA3 or control solution (−). The expression of OsGA20ox2/SD1 (A), OsGA20ox1 (B), and OsGA3ox2/D18 (C) was enhanced in dgl1 and suppressed by GA3 treatment, whereas OsKAO expression (D) was enhanced in dgl1 but not suppressed by GA.

