Figure 8.
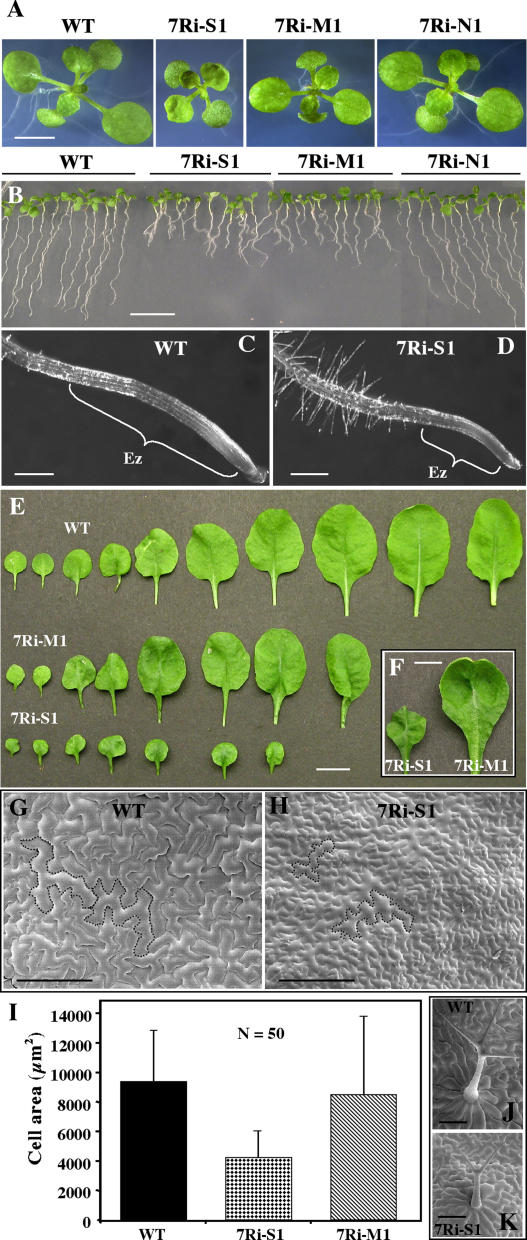
Characterization of root growth and leaf phenotypes of T2 ARP7Ri plants. A, Fourteen-day-old wild-type and ARP7Ri seedlings. 7Ri-S1, 7Ri-M1, and 7Ri-N1 represent strong, moderate, and normal RNAi lines, respectively. WT, Wild type. B, Nine-day-old vertically grown seedlings. C and D, Enlarged view of root tips from wild-type (C) and a strong ARP7Ri (D) plant line. Note the difference in the length of their elongation zones (Ez). E, Rosette leaf series of wild-type and ARP7Ri plants at the time of bolting. All the leaves (except the cotyledons) from each representative plant line are shown. F, Curled rosette leaves from strong and moderate RNAi plants. G and H, SEMs of adaxial leaf surfaces of a wild-type and a strong, dwarf ARP7Ri plant. The perimeters of two representative cells are marked for each sample. I, Average area of leaf epidermal cells. Bars represent sds. J and K, Wild-type (J) and ARP7Ri (K) leaf trichomes. Scale bars = 5 mm (A, F); 10 mm (B, E); 100 μm (C, D, J, K), and 200 μm (G, H).

