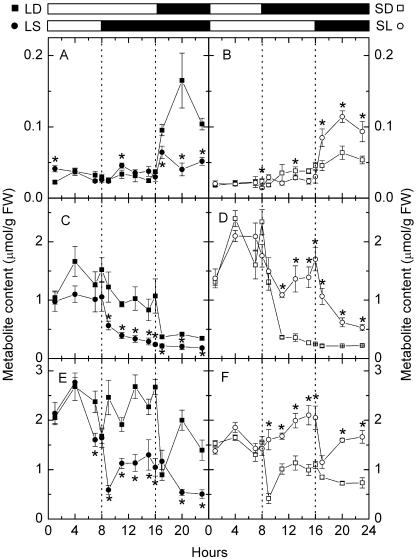
Figure 4.
Diurnal changes of carbohydrate levels in LD, LS, SD, and SL. A and B, β-Maltose; C and D, Glc; E and F, Suc. Left sections, LD (black squares) and LS (black circles). Right sections, SD (white squares) and SL (white circles). White bars and black bars on the top indicate days and nights, respectively. Asterisks near circles indicate that LS or SL samples (circles) are significantly different from LD or SD samples (squares) collected at the same local time (Student's t test, P = 0.05). Values are mean ± se (n = 5).

