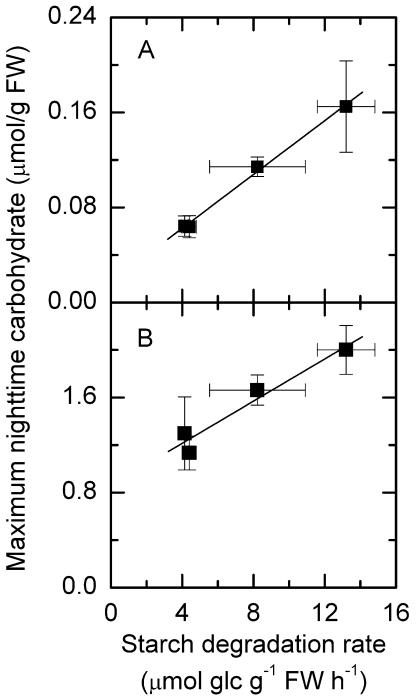
Figure 5.
Linear regression of maximum nighttime carbohydrate levels with starch degradation rates. A, β-Maltose (r2 = 0.996); B, Suc (r2 = 0.945). Average rates of starch degradation were estimated by a linear regression of all the nighttime values of starch over the duration of the night. Values on the x axis are slopes and ses of the linear regressions when estimating the rate of starch degradation. Values on y axis are mean ± se (n = 5).

