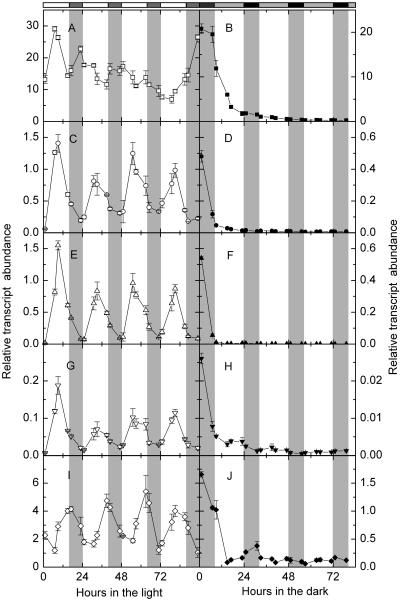
Figure 6.
Relative transcript abundance of starch degradation-related genes in continuous light or continuous darkness. A and B, RbcS1A; C and D, DPE2; E and F, AtPHS2; G and H, SEX1; I and J, CT-BMY. Left sections, Continuous light, white symbols. Right sections, Continuous darkness, black symbols. White bars and gray bars on the top are subjective days and nights. Values are mean ± se (n = 3).

