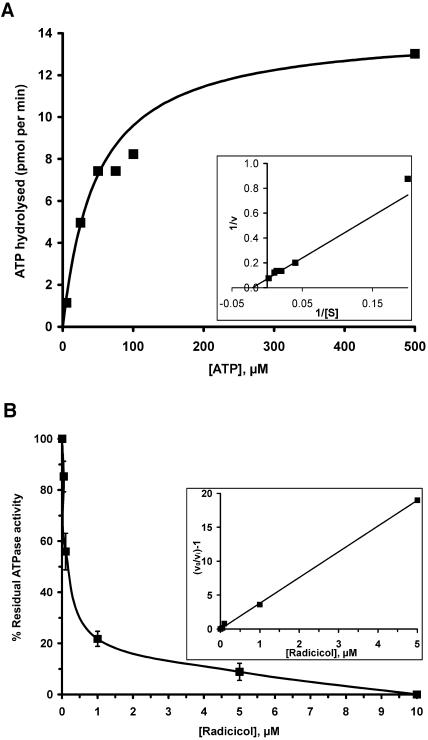
Figure 8.
ATPase activity of purified HSP90C and its inhibition by radicicol. A, Initial rates of ATP hydrolysis (i.e. the conversion of [γ-32P]ATP to 32Pi and ADP) were measured as a function of ATP concentration using one micromolar heterologously expressed HSP90C. Values for Km and Vmax (48 μm and 14.2 pmol min−1, respectively) were determined using a direct linear plot according to Eisenthal and Cornish-Bowden (1974). Km and Vmax values were inserted into the Michaelis-Menten equation v = Vmax[S]/(Km + [S]) to draw the curve shown. Inset, The data are replotted double reciprocally in a Lineweaver-Burk plot. Km and Vmax values were inserted into equation 1/v = {(Km/Vmax)1/[S]} + 1/Vmax to draw the straight line shown. B, Inhibition of HSP90C's ATPase activity by increasing concentrations of radicicol. One micromolar HSP90C was used at a fixed ATP concentration of 50 μm. Each data point represents the mean of three independent experiments; error bars indicate SEM. Inset, The data are replotted according to equation v0/vi − 1 = [I]1/Ki(app). The value obtained for Ki(app) is approximately 0.26 μm, giving a Ki for radicicol of approximately 0.13 μm at 50 μm ATP.

