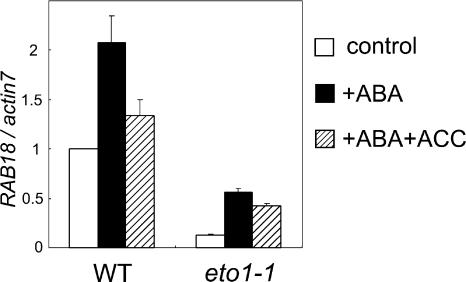
Figure 3.
ABA responses of epidermal tissues of wild-type and eto1-1 plants. Expression patterns of an ABA-induced gene, RAB18, were compared between the wild type and eto1-1. mRNA was extracted from epidermal tissues before treatment (white bars) and after treatment with 10 μm ABA (black bars) or 10 μm ABA plus 100 μm ACC (striped bars) in opening buffer without Tween 20 for 2 h. Gene expression levels were measured by real-time quantitative PCR, and the relative amounts of transcripts then calculated and normalized with actin7 mRNA. Bars represent the means ± ses (n = 6–9). The data were analyzed by ANOVA. Difference between wild type + ABA and wild type + ABA + ACC was significant (0.01 ≤ P < 0.05), and between wild type + ABA and eto1-1 + ABA was significant (P < 0.01).

