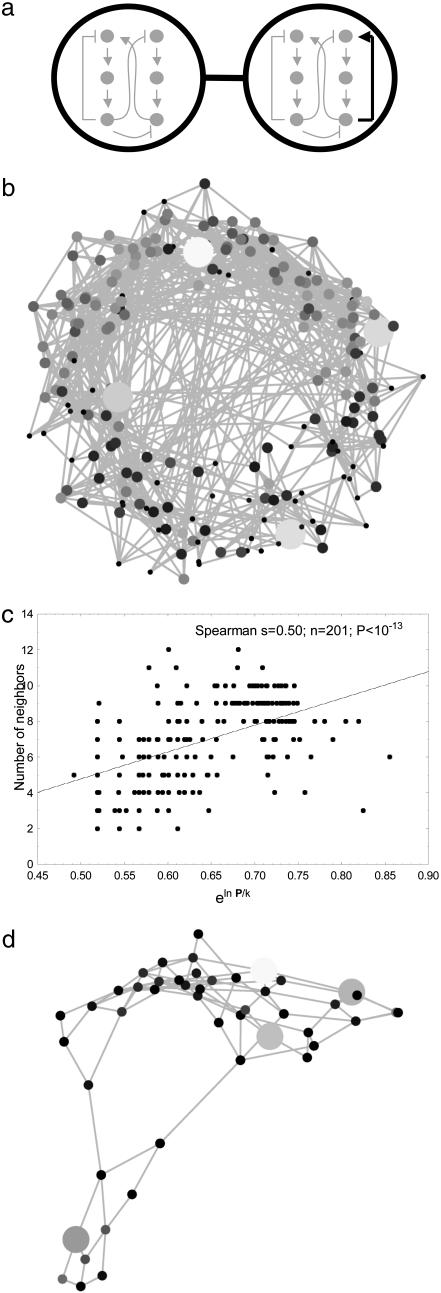
Fig. 2.
A graph connecting circuits of different topology. (a) Illustration of the concept behind this graph. Shown are two nodes of this graph (large circles). Each node corresponds to a circuit of a given topology that allows circadian oscillations (drawings inside the circles). The circuits shown correspond to topologies 19810 and 20710, both of which have P > 0. The two nodes are connected, because they are topological neighbors, i.e., they differ by only one regulatory interaction (bold arrow in right-hand circle). (b) The structure of this graph for all oscillator topologies where at least one in 5 × 10³ random parameter combinations yielded circadian oscillations. Topologies (circuits) with large P are indicated by larger circles and lighter shading than topologies with small P. (c) Nodes (circuit topologies) with many neighbors in the graph in Fig. 2a show greater eln P/k. (d) The same graph for those 47 oscillator topologies where at least one in 100 parameter combinations yielded circadian oscillations.

