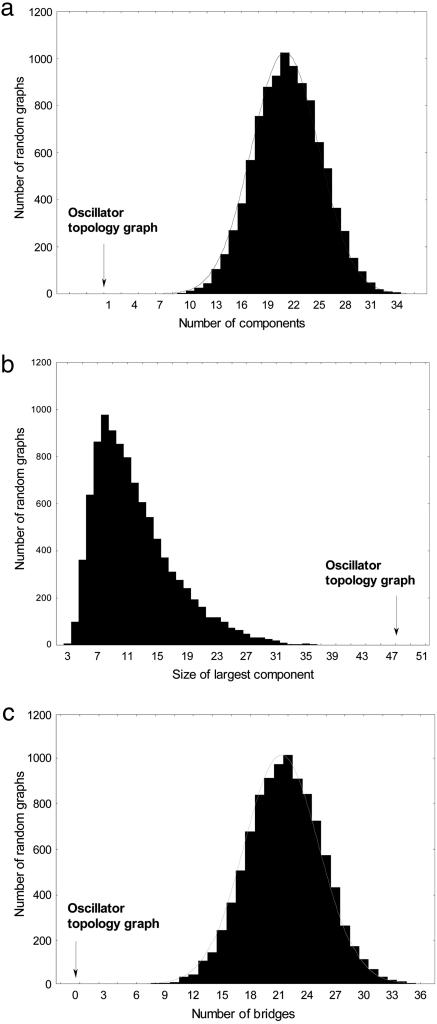
Fig. 3.
Oscillator topology graphs vs. random topology graphs. Shown are the distributions of three graph characteristics for 10,000 random graphs whose nodes correspond to circuit topologies (Fig. 2a) compared (vertical arrows) with the structure of the graph of Fig. 2d, which has 47 nodes, each of which yields oscillations with P > 0.01. Each random graph was established by choosing a random sample of 47 of a total of 378 possible topologies and defining topologies as neighboring that differ by only one regulatory interaction. As opposed to the topologies of the oscillator topology graph, many of these randomly chosen topologies may not yield oscillations. (a) Number of components (groups of nodes connected to each other but to no other node). (b) Size of the largest component. (c) Number of bridges.

