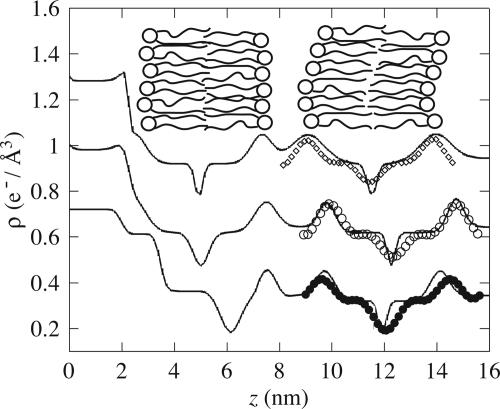
Fig. 4.
Electron-density profiles of di-C18-PC obtained by specular reflectivity using 1G-hybrid model (lines) and by off-specular reflectivity using the Fourier expansion (symbols). Top curve, an adsorbed sample in the gel phase (line, T = 25°C; diamonds, T = 48°C); middle curve, in the fluid phase (line, T = 56°C; open circles, T = 56°C); bottom curve, a grafted sample in the fluid phase (line, T = 57°C; filled circles, T = 56°C). (Inset Left to Right) The silicon substrate (not schematized), the first layer (here drawn in the case of adsorbed bilayer), the floating bilayer (drawn), and the water (beyond the right side of the figure). To facilitate comparison, we have aligned vertically (around z = 7.5 nm) the peaks of the fixed lipid heads. The top and middle curves have been shifted vertically by +0.6 e–/Å3 and +0.3 e–/Å3, respectively, for clarity.

